Introduction
A ThingsBoard dashboard is a visual representation of the data collected from your IoT devices, presented in a way that is easy to understand and interpret. Dashboards in ThingsBoard can be customized to suit your specific needs, and can include a wide range of visualizations, such as charts, graphs, and maps.
Create ThingsBoard Dashboard
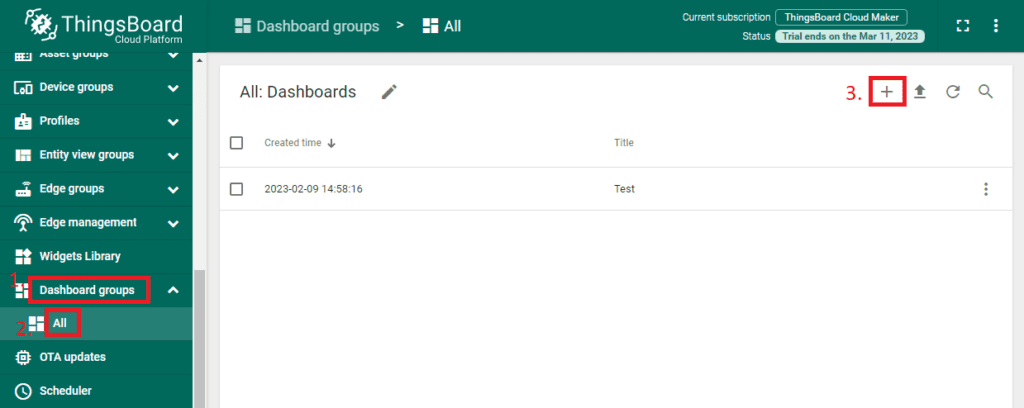
Log into the ThingsBoard dashboard then select ‘Dashboard groups’ and then ‘All’ from the left-side menu. From there, click the ‘+’ button on the top right of the screen to create a new dashboard.
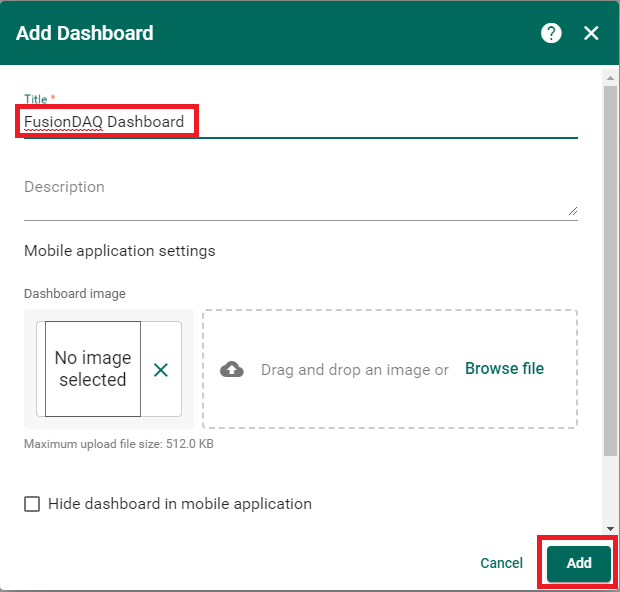
Give the dashboard a descriptive name and then click the ‘Add’ button
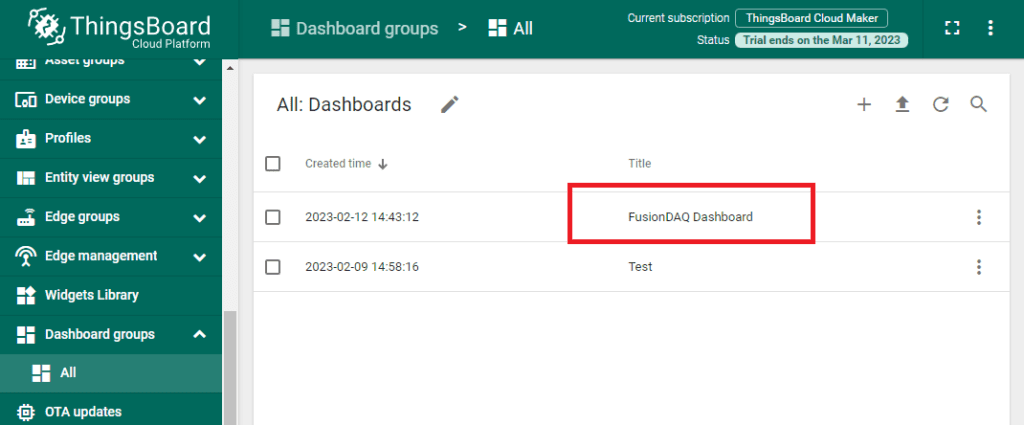
Now that a blank dashboard is freshly created, click on it in the Dashboard groups page.
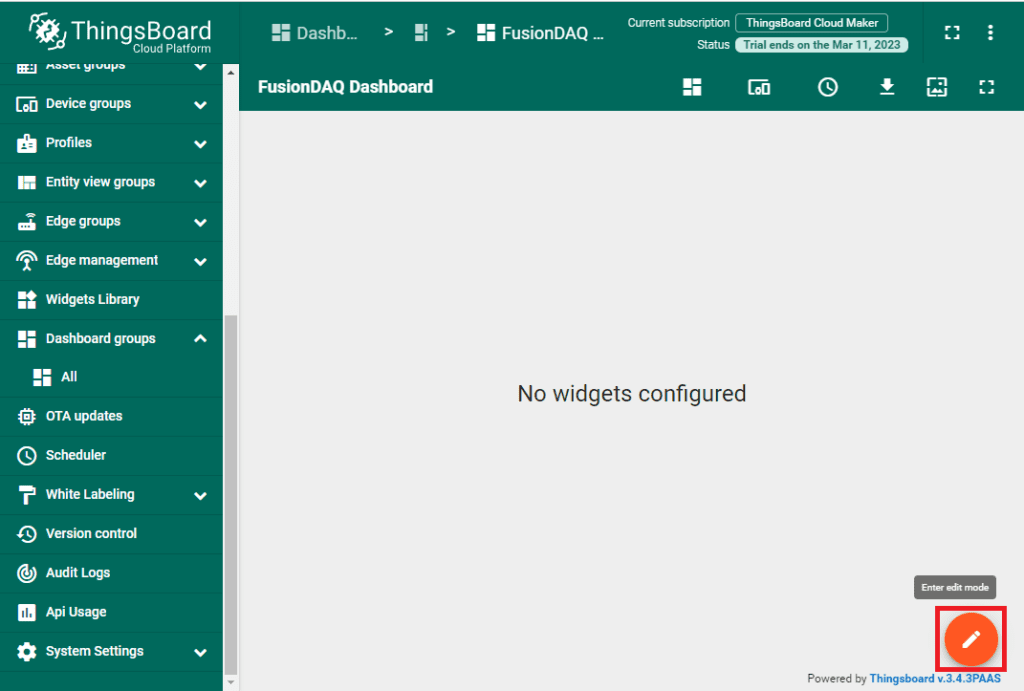
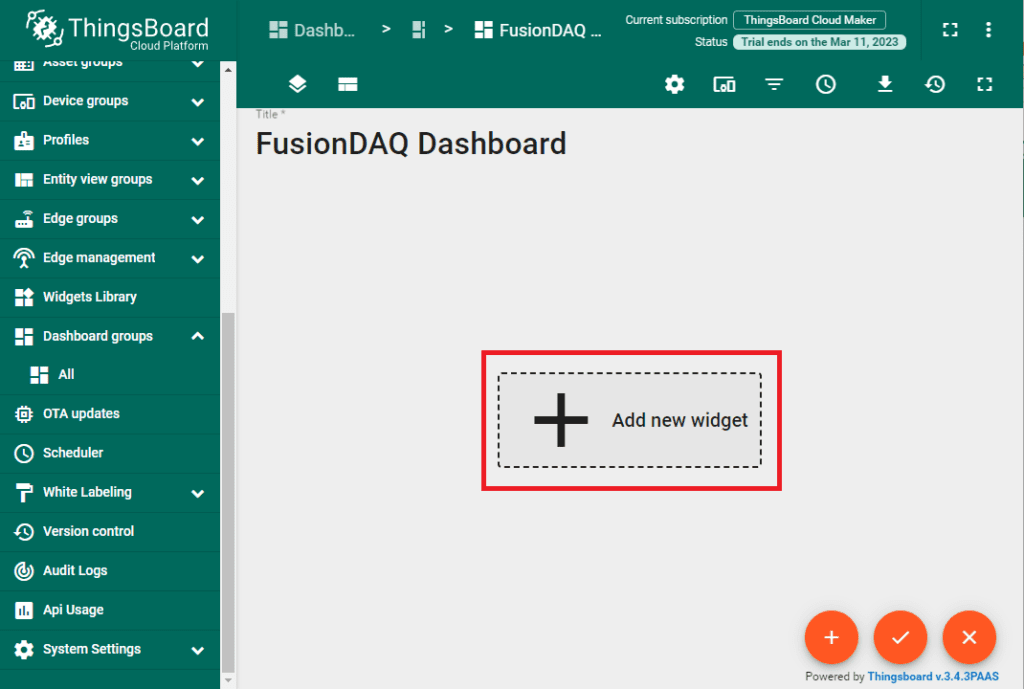
At this point the dashboard is empty. Click on the orange pencil edit button on the bottom right of the screen
And then click the ‘Add new widget’ button in the center of the screen.
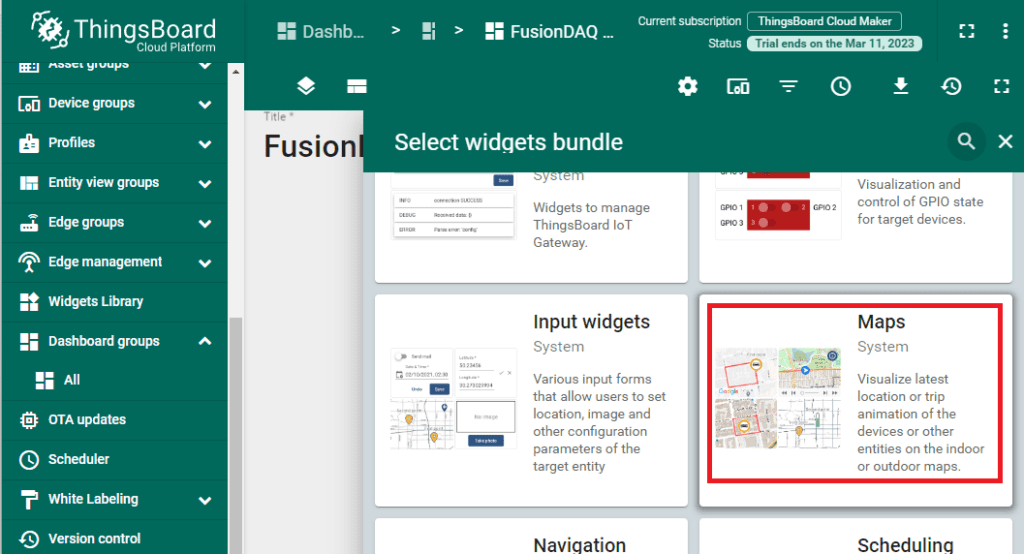
There are many predefined widgets ranging from simple text boxes to strip charts and maps. In this example let’s create a map widget to display the location of a MI-8 DAQ. Select ‘Maps’.
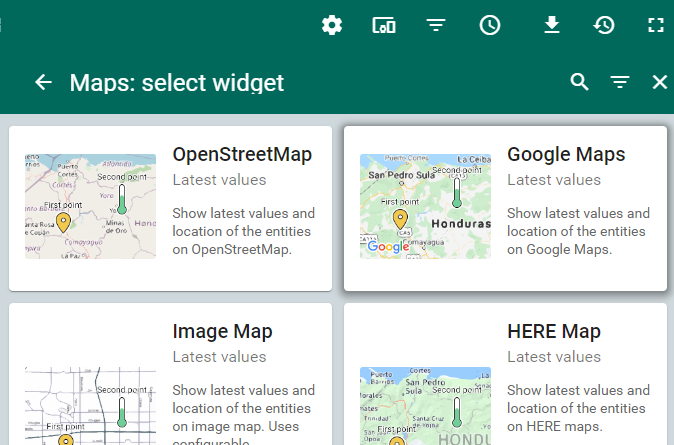
Then choose ‘Google Maps’.
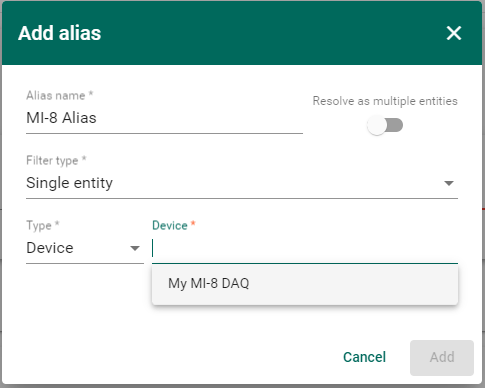
Next we need to identify which device will provide the data for the map. Things board refers to this as the datasource. Here we want to select a single MI-8 DAQ. Click the ‘Add’ button.
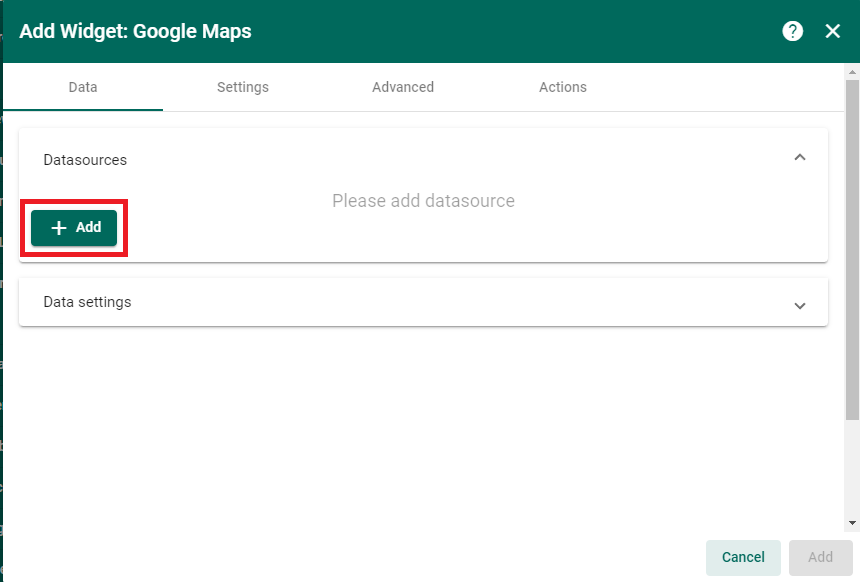
The ‘Alias Name’ isn’t important, but the ‘Type’ and ‘Device’ fields are. Choose an existing MI-8 Device which has already been created in things board. Refer back to our article describing how to connect a MI-8 to ThingsBoard.
Now that the datasource is identified (our MI-8 DAQ), the data keys must be specified. The data keys are the individual telemetry fields provided by the MI-8. The field names in ThingsBoard are the same as the names in the MI-8 config.json and on the MI-8 built-in display.
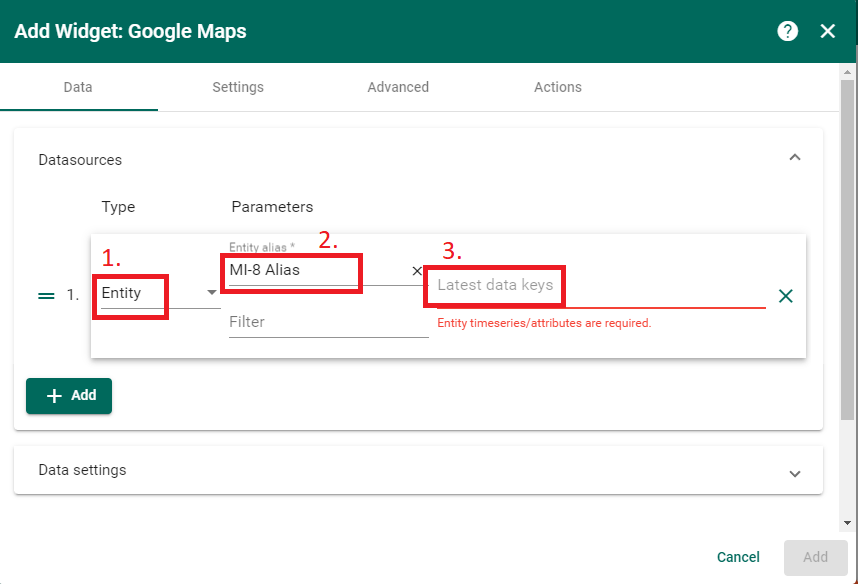
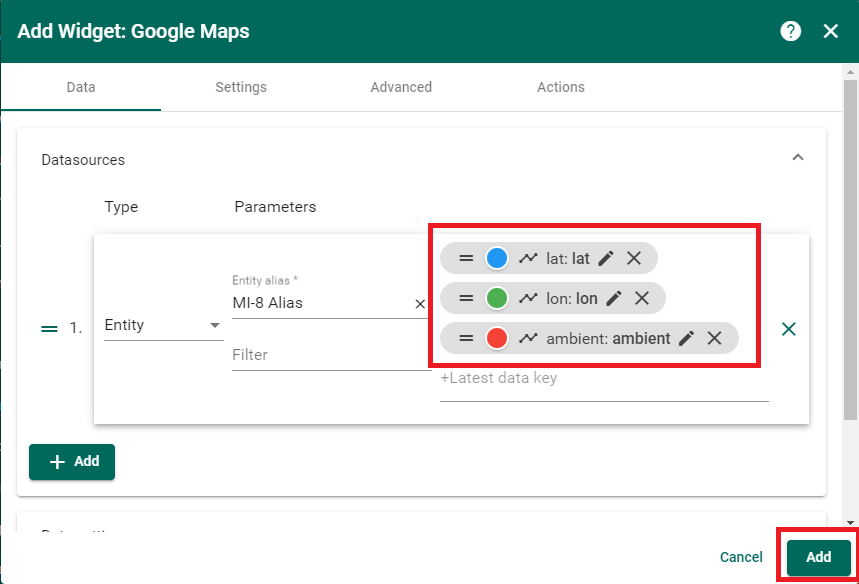
Add data keys for latitude (lat), longitude (lon), and ambient MI-8 temperature (ambient), then click ‘Add’. This will insert the map widget onto the dashboard canvas.
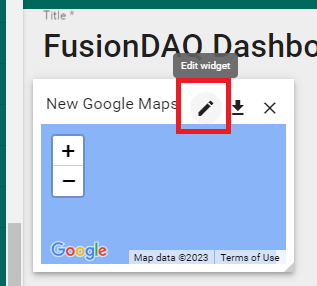
Some minor changes must now be made to the default ThingsBoard map widgets in order for them to correct plot MI-8 position. Click on the pencil ‘Edit’ button on the map widget.
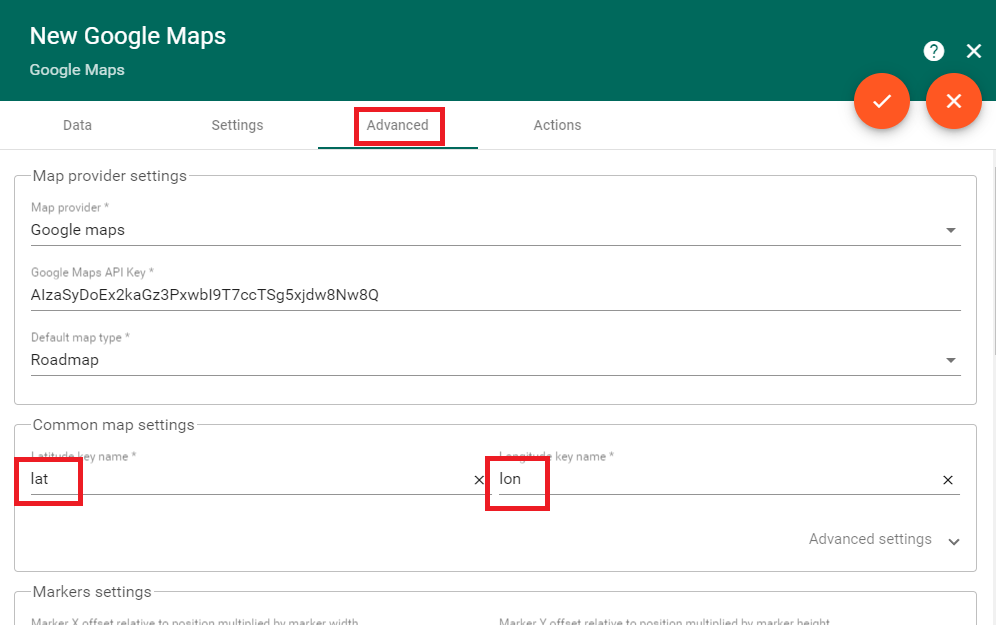
And then click on the ‘Advanced’ tab. By default, ThingsBoard expects latitude and longitude to be named ‘latitude’ and ‘longitude’. However, these fields are named ‘lat’ and ‘lon’ by the MI-8. Change the data key names used by the map widget under the ‘Common map settings’ area.
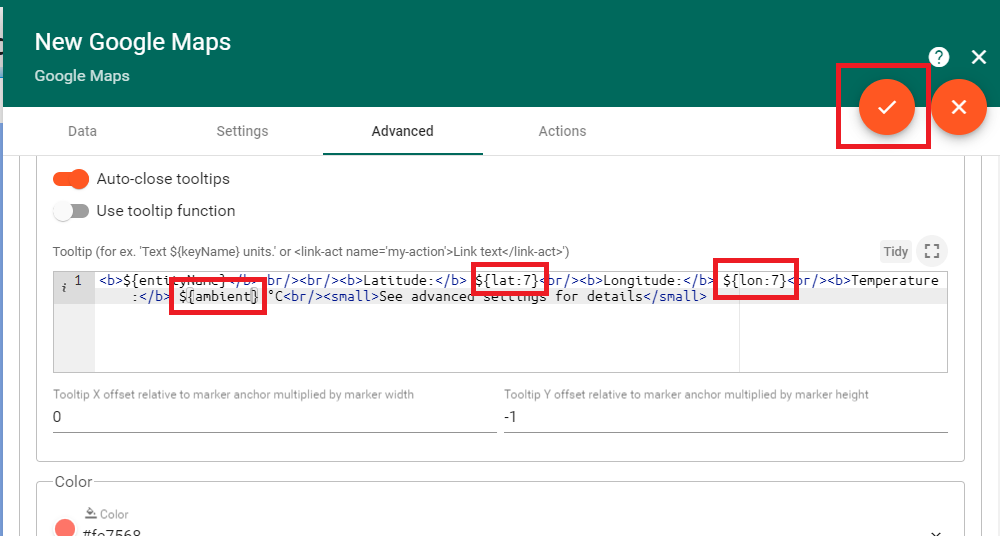
Next update the tooltip settings to display the MI-8 position as well as ambient temperature. Again, rename the data key names to ‘lat’, ‘lon’, and ‘ambient’. Click on the orange check mark button on the top right when finished to save your changes.
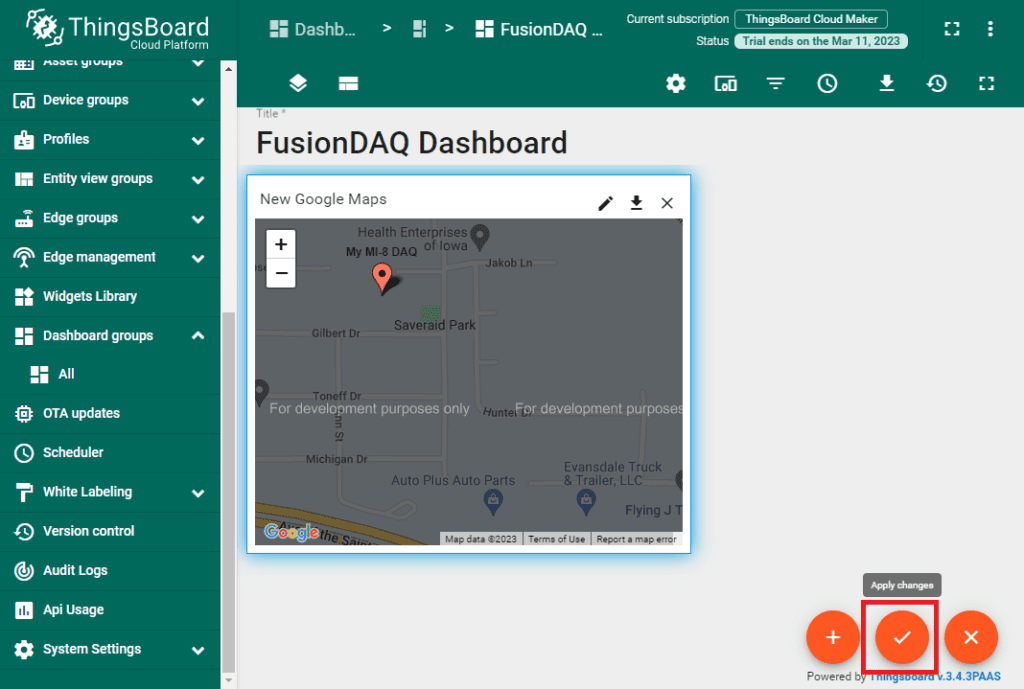
Finally click the orange check mark button on the bottom right of the canvas to save the dashboard and begin using it.
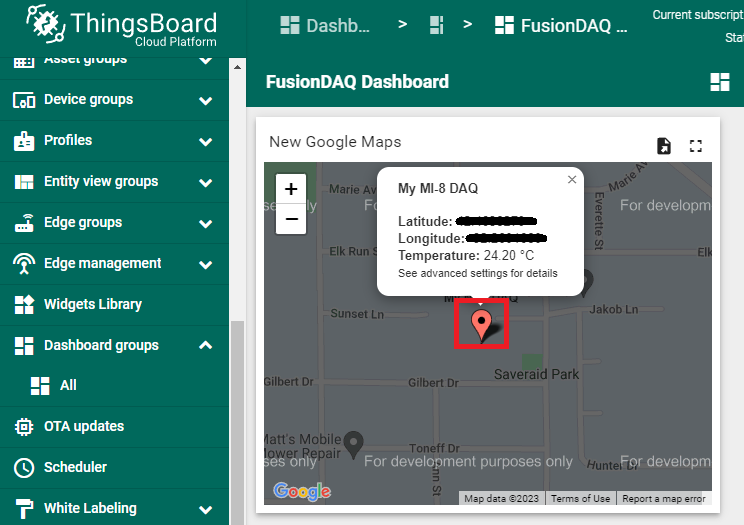
The location of the MI-8 should now be visible in the map widget under the red thumb tack. If you click on the thumb tack a tool tip window will appear which provides the MI-8 location and temperature.
Conclusion
Dashboards are highly customizable, and you can choose from a wide range of pre-built widgets, or create your own custom widgets using HTML, CSS, and JavaScript. This allows you to create a dashboard that provides exactly the information you need, presented in a way that is easy to understand and interpret. Overall, ThingsBoard dashboards are an essential tool for monitoring and analyzing data from your IoT devices, and can help you to identify issues, optimize performance, and make data-driven decisions.